
Data Visualization to Change the World
In the era of greater data accessibility and new tools, many people and organizations are finding fascinating ways to use data to educate, convince and make connections about the social and environmental challenges of our time. Here are 10 interesting tools and visualizations that I've come across that give a sense of the scope and range of the data visualization world out there.
 Love it or hate it, spreadsheets are the number one data tracking tool in many community-based organizations.
 In past posts you may have followed our research project with the BC Association of Farmers’ Markets to develop a Farmers’ Market Impact Toolkit.This toolkit was piloted with 9 farmers markets in the summer of 2012 in British Columbia (Canada) and a final version of the toolkit is posted
 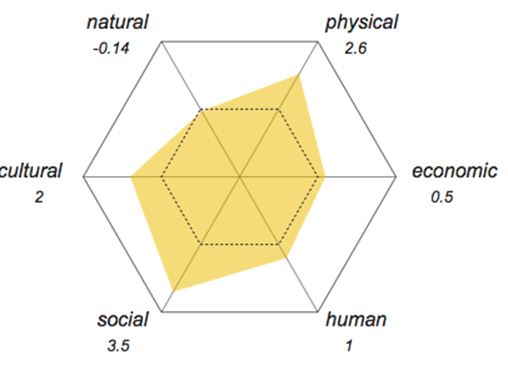 I came across this nifty tool when I attended the 6th ANSER conference in Victoria, June 6, 2013. The Community Capital Tool is a decision support and assessment tool, based on the community capital framework, that is designed to facilitate and ground community discussion about integrated planning and monitoring.
 It’s not all about the games.
 Keeping an eye on the right financial metrics can allow you to respond to issues before they spin out of control. Financial performance is a key part of the Demonstrating Value Framework.